System Head Curves Editor Dialog
The System Head Curve editor allows you to define and calculate a graph of head vs. flow that shows the head required to move a given flow rate through the selected pump and into the distribution system.
To create a new System Head Curve Definition:
- Click Compute. (EPS settings must be on in order to utilize this feature.)
- From the Analysis tab, click More (under Analysis Tools group) and then click System Head Curves; or right click on the pump and click System Head Curve and skip to step 5.
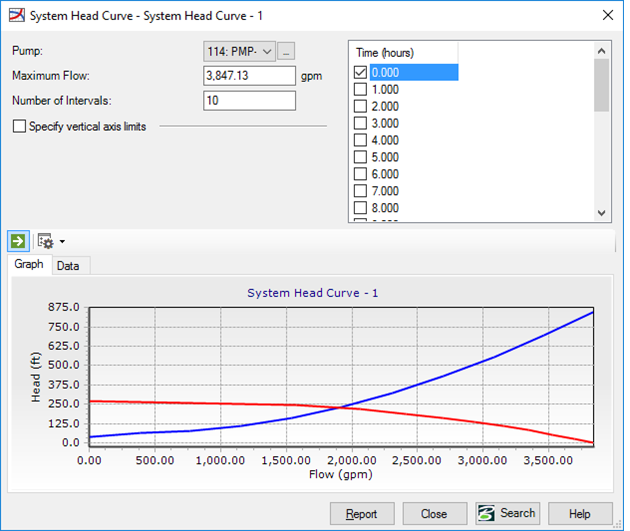
- Click New, which will open the System Head Curve editor. The System Head Curves Editor is where you can specify the settings of a System Head Curve Definition. You can also compute and view the system head curve for a specific time step.
- Choose the pump that will be used for the system head curve from the Pump pulldown menu, or click the ellipsis and click the pump to be used in the drawing pane.
- Type a value for Maximum Flow for the system head curve and Number of Intervals, which controls the smoothness of the curves.
- Choose a time step (or steps) in the Time (hours) column.
- Click Compute to calculate the results for the specified time step.
- View the results as a graph or data.
- If the scaling of the vertical axis is too large check the checkbox "Specify vertical axis limits", add the desired minimum and maximum head for the vertical axis and compute the system head curve again. The system head curve for a constant speed pump at one time step is shown below:
- Usually only the pump head
curve corresponding to the one entered by the user is displayed. However, if
the pump is a variable speed pump, the user has the option of also displaying
the pump head curves at various speeds corresponding to selected times. To
display those curves, check "Show Variable Speed Pump Curves?" The system head
curves to a variable speed pump at multiple time steps is shown below:
In the above image, there are multiple pump curves, one at each time selected. The full speed pump curve is also included and colored slate gray. If a selected time has a calculated relative speed factor of 1.0, then the default pump curve is not included and the calculated pump curve is used instead.
- To display or hide the legend, click the drop-down arrow next to the Chart Options toolbar button and click Show Legend. If the menu item is already checked, it will hide the legend.
- To change the graph options of the system head curves or export the curves, click the Chart Options button above the graph.
- To display the tabular view of the system head curve or export it, select the Data tab above the graphs.
- Click Report to view the report.
- Click Close to exit the System Head Curve editor.

Note: You can select more
than one time step for the system head curve calculation by holding down the
<Ctrl> key and clicking each time step that you want to calculate.